Why Your Stack Trace Isn’t Enough: A Practical Guide to Debugging JavaScript, TypeScript, and Node.js Errors
Debugging is rarely about finding the line that crashed.
The harder problem is figuring out why the application reached that line in the first place.
You can have a 50-line stack trace, a familiar error message, and an IDE full of debugging tools—and still spend an hour trying random fixes.
This is especially common with modern JavaScript and TypeScript applications, where errors can travel through async functions, promises, middleware, API calls, database layers, and third-party packages before finally appearing at the point of failure.
This guide explains a practical approach to JavaScript debugging, TypeScript debugging, Node.js error handling, stack trace analysis, and production debugging.
And if you want to speed up the investigation process, I'll also show where an automated debugging investigation tool like KaudDoc can fit into the workflow.
The Real Problem With Debugging
Consider a typical Node.js error:
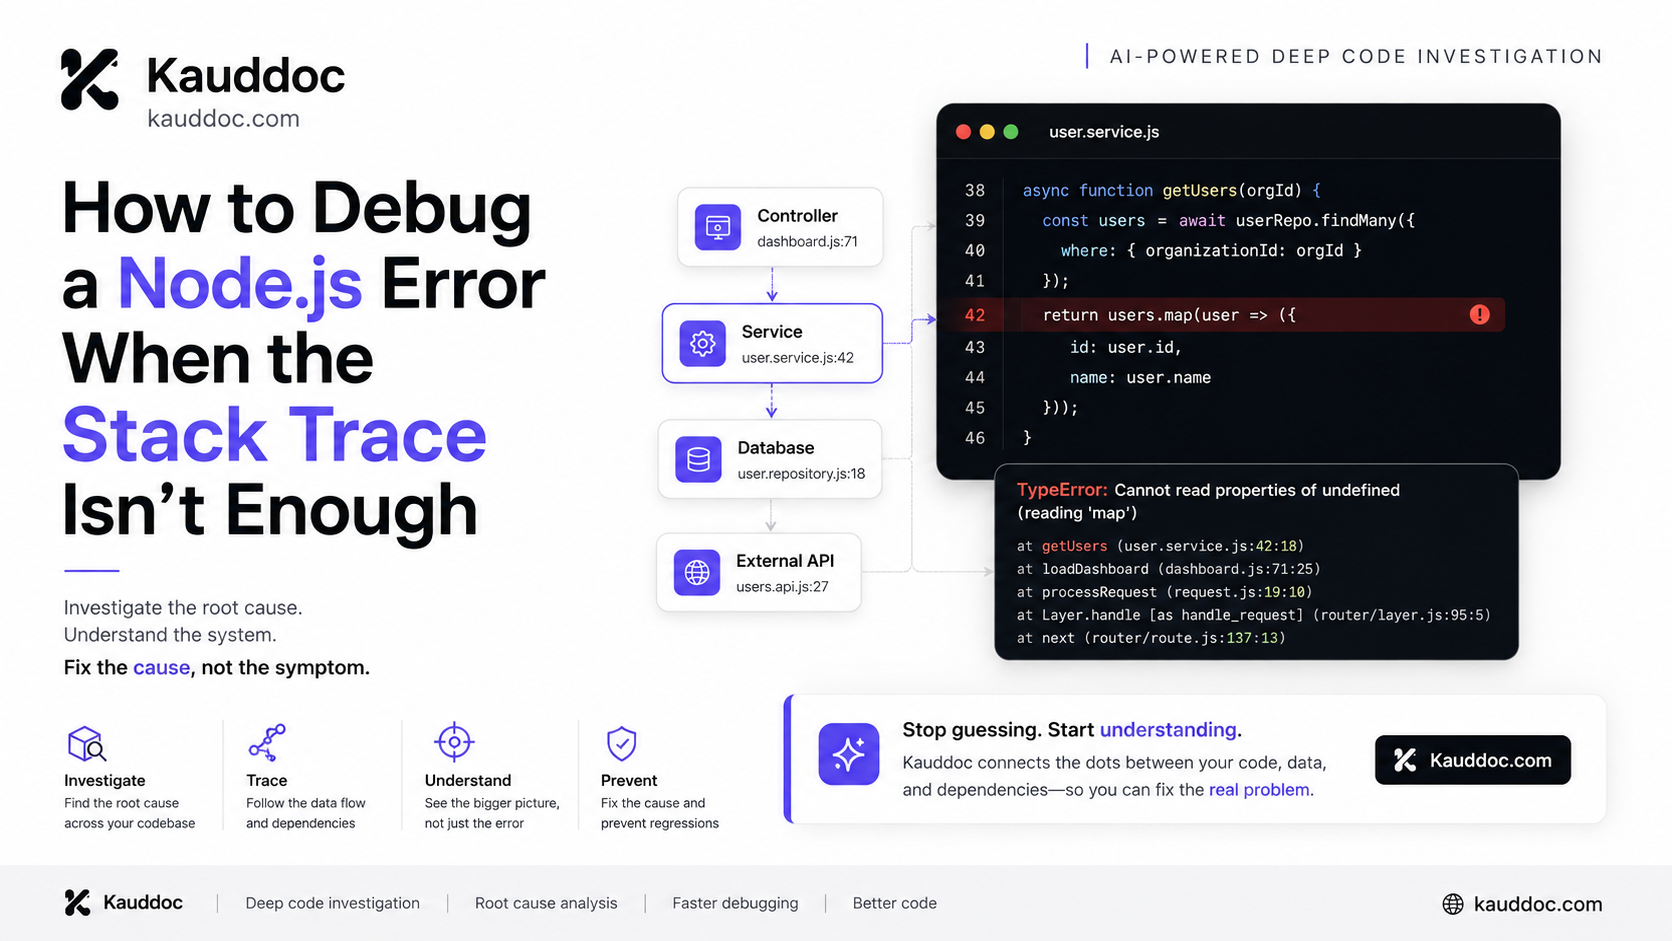
TypeError: Cannot read properties of undefined (reading 'email')
    at getUser (/app/services/user.js:42:18)
    at processRequest (/app/controllers/auth.js:87:12)
    at async handler (/app/routes/auth.js:31:5)
The obvious conclusion is:
useris undefined.
But that isn't necessarily the real problem.
The real question is:
Why was user undefined?
Maybe:
The database query returned no record.
An API returned an unexpected response.
A promise resolved differently than expected.
Authentication middleware didn't populate the request.
A variable was overwritten.
A TypeScript type didn't match runtime data.
A third-party API changed its response.
A race condition occurred.
An earlier failure was swallowed.
The crashing line is often only the last visible symptom.
That's why effective debugging requires more than reading the last line of a stack trace.
1. Start With the Error, But Don't Stop There
The first step is still understanding the actual exception.
Common JavaScript errors include:
TypeError
TypeError: Cannot read properties of undefined
Usually indicates that your code is accessing something that doesn't exist.
ReferenceError
ReferenceError: userId is not defined
The variable doesn't exist in the current scope.
SyntaxError
SyntaxError: Unexpected token
The JavaScript parser couldn't understand the code.
RangeError
RangeError: Maximum call stack size exceeded
Often associated with uncontrolled recursion or excessively deep calls.
But the error type only gives you a starting point.
2. Read the Stack Trace From the Bottom Up
A common debugging mistake is looking only at the first line.
Instead, inspect the call chain.
For example:
TypeError: Cannot read properties of undefined
    at calculatePrice (pricing.js:120)
    at checkout (checkout.js:84)
    at processOrder (orders.js:51)
    at async handler (api.js:23)
The immediate failure happened inside:
calculatePrice()
But the execution path was:
handler()
   ↓
processOrder()
   ↓
checkout()
   ↓
calculatePrice()
   ↓
ERROR
That context matters.
The function that crashed isn't always the function that introduced the bad state.
3. Find the First Suspicious State
Instead of asking:
"Where did the application crash?"
Ask:
"Where did the data first become incorrect?"
This is one of the most useful debugging habits you can develop.
Suppose:
const user = await getUser(userId);

return user.profile.email;
The crash happens at:
user.profile.email
But you should investigate:
getUser(userId)
Why?
Because getUser() may have returned:
null
or:
{
  id: "123"
}
instead of:
{
  id: "123",
  profile: {
    email: "user@example.com"
  }
}
The visible exception is downstream from the actual problem.
4. Async JavaScript Makes Debugging Harder
Modern applications heavily depend on asynchronous code.
For example:
async function createOrder(userId) {
  const user = await getUser(userId);
  const cart = await getCart(userId);
  const payment = await chargeCard(user, cart);

  return payment;
}
If something fails, the problem might originate in:
getUser()getCart()chargeCard()the arguments passed between them
an external API
a database query
This is why debugging asynchronous JavaScript requires looking at the execution flow, not just the exception.
5. TypeScript Doesn't Eliminate Runtime Errors
TypeScript catches many problems before your code runs.
But TypeScript types don't magically guarantee that external data is correct.
Consider:
interface User {
  id: string;
  email: string;
}

const response = await fetch("/api/user");
const user = await response.json() as User;

console.log(user.email);
The cast:
as User
doesn't validate the response.
The server could return:
{
  "id": "123"
}
and TypeScript won't stop the application at runtime.
This is an important distinction:
Compile-time correctness ≠ runtime correctness.
When debugging TypeScript applications, investigate both.
6. Don't Trust the Error Message Too Literally
Error messages are useful, but they're not always the complete story.
For example:
Cannot read properties of undefined (reading 'map')
You know something is undefined.
But there could be many causes:
const items = response.data.items;
Maybe:
responseis undefined.response.datais undefined.itemsis undefined.The API returned an unexpected schema.
The request failed but the code continued.
A transformation removed the property.
The message identifies the immediate failure.
Your job is to reconstruct the chain that produced it.
7. Production Debugging Is Different
Local debugging is relatively easy.
You can:
Add breakpoints.
Inspect variables.
Restart the application.
Reproduce the request.
Modify the code.
Production is different.
You may have:
incomplete logs
distributed services
background jobs
unfamiliar input
intermittent failures
multiple versions deployed
external API dependencies
errors that cannot easily be reproduced
This is where error investigation becomes more valuable than simply displaying an exception.
A useful debugging report should help answer:
What failed?
Where did it fail?
What execution path led there?
What data was involved?
What is the most likely root cause?
How can it be reproduced?
What should be changed?
How confident are we?
8. AI Can Help With Debugging—If You Give It Enough Context
Developers increasingly use AI coding assistants to explain errors.
That's useful.
But there is a major difference between:
"Explain this error."
and:
"Investigate this failure using the error, stack trace, execution context, relevant source code, and available evidence. Identify the likely root cause and explain how to reproduce and fix it."
The second approach turns AI from a simple code explainer into an investigation assistant.
This is the direction tools like KaudDoc are designed around.
Instead of simply asking an AI:
"What does this error mean?"
you can use an investigation-oriented workflow to understand the failure and produce a structured debugging report.
9. What a Good Debugging Report Should Contain
A useful debugging report could look like this:
Error
TypeError: Cannot read properties of undefined
Location
src/services/userService.ts:87
Execution Path
HTTP request
   ↓
auth middleware
   ↓
user controller
   ↓
user service
   ↓
profile lookup
   ↓
undefined value
Likely Root Cause
The profile lookup can return undefined, but the calling function assumes a profile always exists.
Why It Happens
A newly created user doesn't always have a profile record.
Reproduction
Create a user.
Skip profile creation.
Request
/api/profile.Access the endpoint.
Observe the exception.
Recommended Fix
Validate the result before accessing nested properties.
if (!profile) {
  throw new Error("User profile not found");
}
This is much more useful than simply saying:
"Check if profile exists."
10. A Better Debugging Workflow
Here's a workflow I use when investigating difficult bugs.
Step 1 — Capture the exact failure
Don't paraphrase the error.
Keep:
exception type
message
stack trace
timestamp
request information
Step 2 — Identify the failing operation
Find the exact line and operation that failed.
Step 3 — Reconstruct the call chain
Understand how execution reached that point.
Step 4 — Trace the data
Follow the values entering the failing function.
Step 5 — Find the earliest invalid assumption
Ask:
Where did the program begin behaving differently from what the code expected?
Step 6 — Reproduce the failure
A reproducible bug is dramatically easier to fix.
Step 7 — Fix the underlying cause
Don't simply hide the exception.
Step 8 — Add a regression test
Make sure the same failure doesn't silently return.
11. Debugging vs. Guessing
There's a huge difference between these two approaches.
Guessing
Maybe the database is broken.

Try restarting the server.
Investigation
The database query returns no record for users created
without a profile. The service assumes the record exists,
then accesses profile.email without validation.
The second one is actionable.
Good debugging isn't about generating the largest number of possible causes.
It's about reducing uncertainty until one explanation is supported by evidence.
12. Where KaudDoc Fits
When a debugging problem becomes complicated, manually collecting all the relevant context can take longer than fixing the actual bug.
That's the problem KaudDoc is built to help with.
KaudDoc is an AI-powered debugging investigation tool designed to help developers go beyond a basic error explanation and investigate failures more systematically.
Instead of only asking:
"What does this stack trace mean?"
the goal is to get closer to:
"What actually happened, why did it happen, and what should I do next?"
That distinction matters when working with:
JavaScript errors
TypeScript errors
Node.js exceptions
stack traces
asynchronous failures
API failures
production bugs
difficult-to-reproduce issues
You can use it as another layer in your debugging workflow when a normal IDE debugger or error message isn't giving you enough context.
13. The Future of Developer Debugging
Developer tooling is moving from passive error reporting toward active investigation.
Traditional tooling tells you:
Something failed.
Modern tooling increasingly tries to answer:
Something failed.

Here's what happened.

Here's where the failure started.

Here's the likely root cause.

Here's the evidence.

Here's how to reproduce it.

Here's what you should investigate next.
That's a much more useful developer experience.
AI is particularly interesting here because debugging is fundamentally a reasoning problem.
The challenge isn't just generating code.
It's connecting:
symptoms → execution flow → state → assumptions → root cause → fix
Conclusion
The next time you encounter a difficult JavaScript, TypeScript, or Node.js error, don't immediately start changing code.
Start investigating.
Read the entire stack trace.
Trace the execution path.
Follow the data.
Identify the first incorrect assumption.
Reproduce the failure.
Then fix the underlying cause.
And when the debugging problem becomes too complex to investigate manually, tools such as KaudDoc can help turn scattered debugging information into a more structured investigation.
Because the best debugging question isn't:
"How do I remove this error?"
It's:
"Why did this error happen in the first place?"
That's where real debugging begins.