Why We Built Kauddoc: Looking Beyond the Error Message
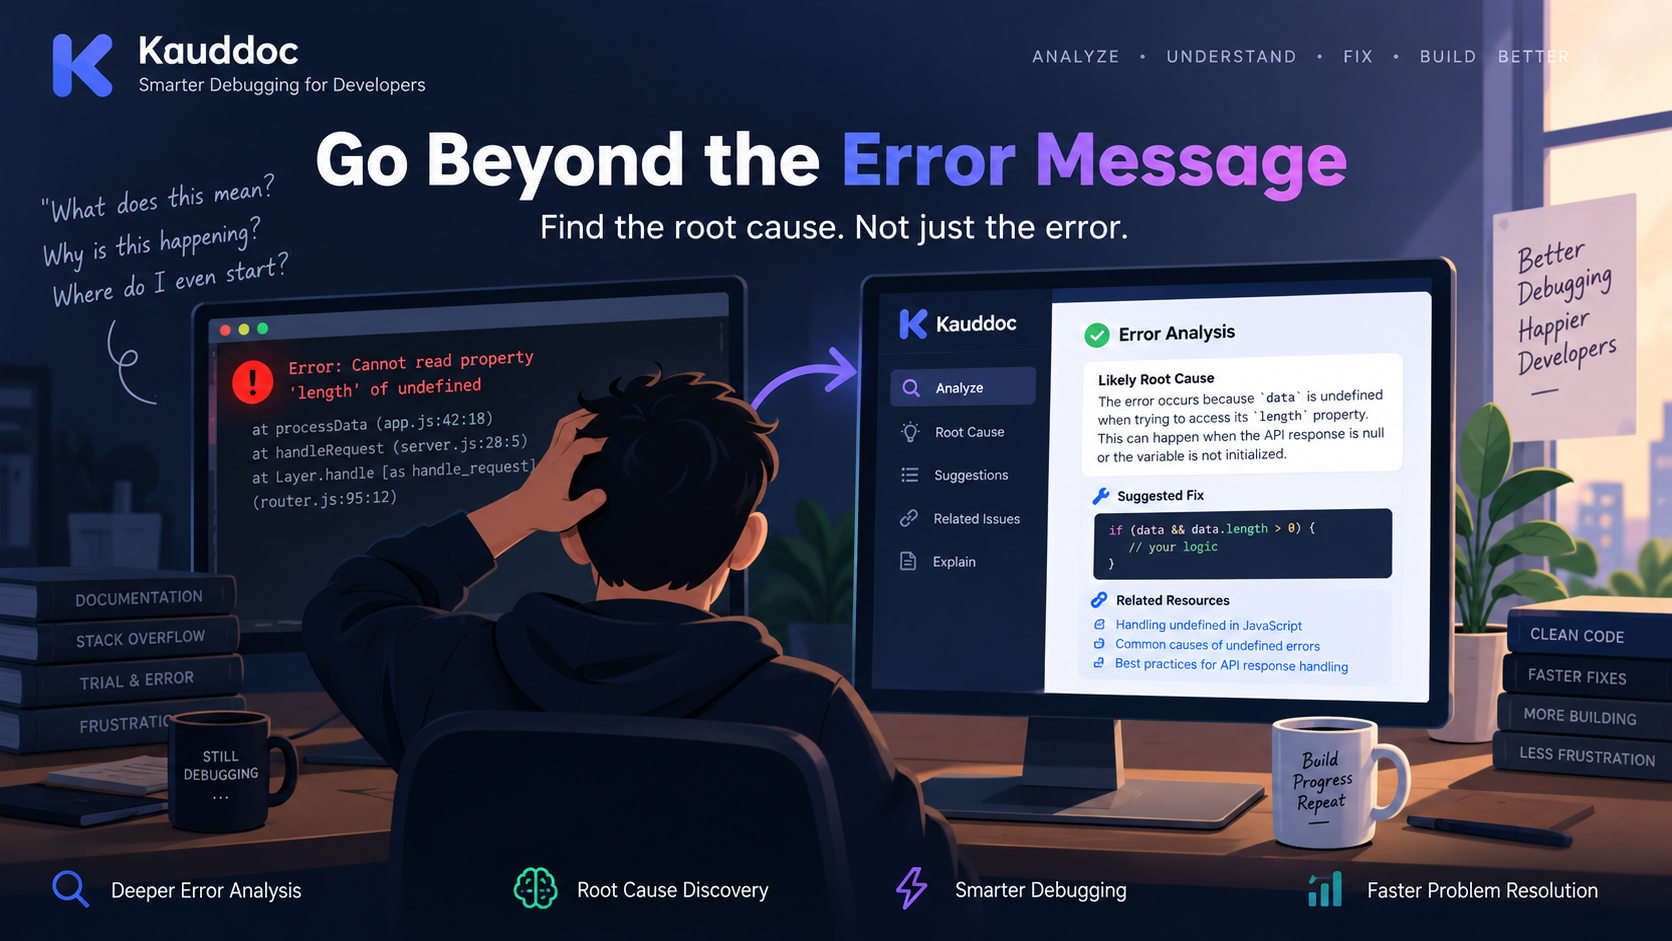
Every developer has experienced this:
You run your application.
Something breaks.
An error appears.
And now the real work begins.
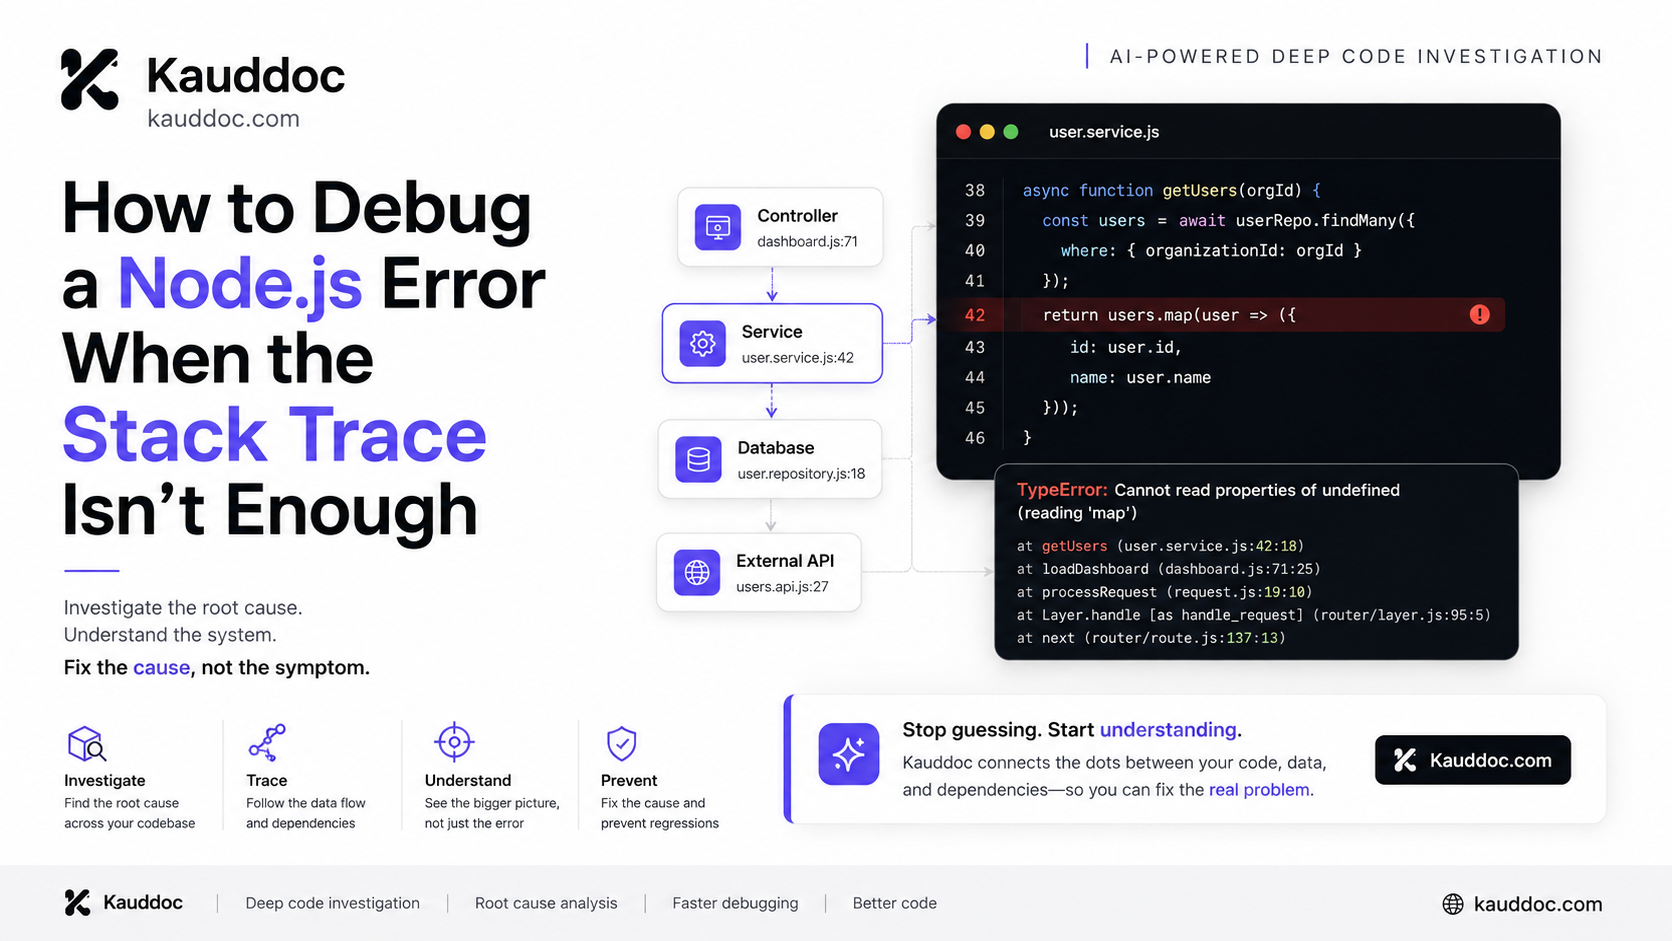
The error message might tell you what happened, but it doesn't always explain why it happened.
That's the problem we're trying to solve with Kauddoc.
Debugging is more than reading errors
Modern applications are complex. A single error can be caused by:
An incorrect configuration
A dependency conflict
Unexpected data
A missing environment variable
An issue somewhere else in the codebase
Multiple problems happening at the same time
Finding the actual root cause can take significantly longer than fixing the final issue.
What we're building with Kauddoc
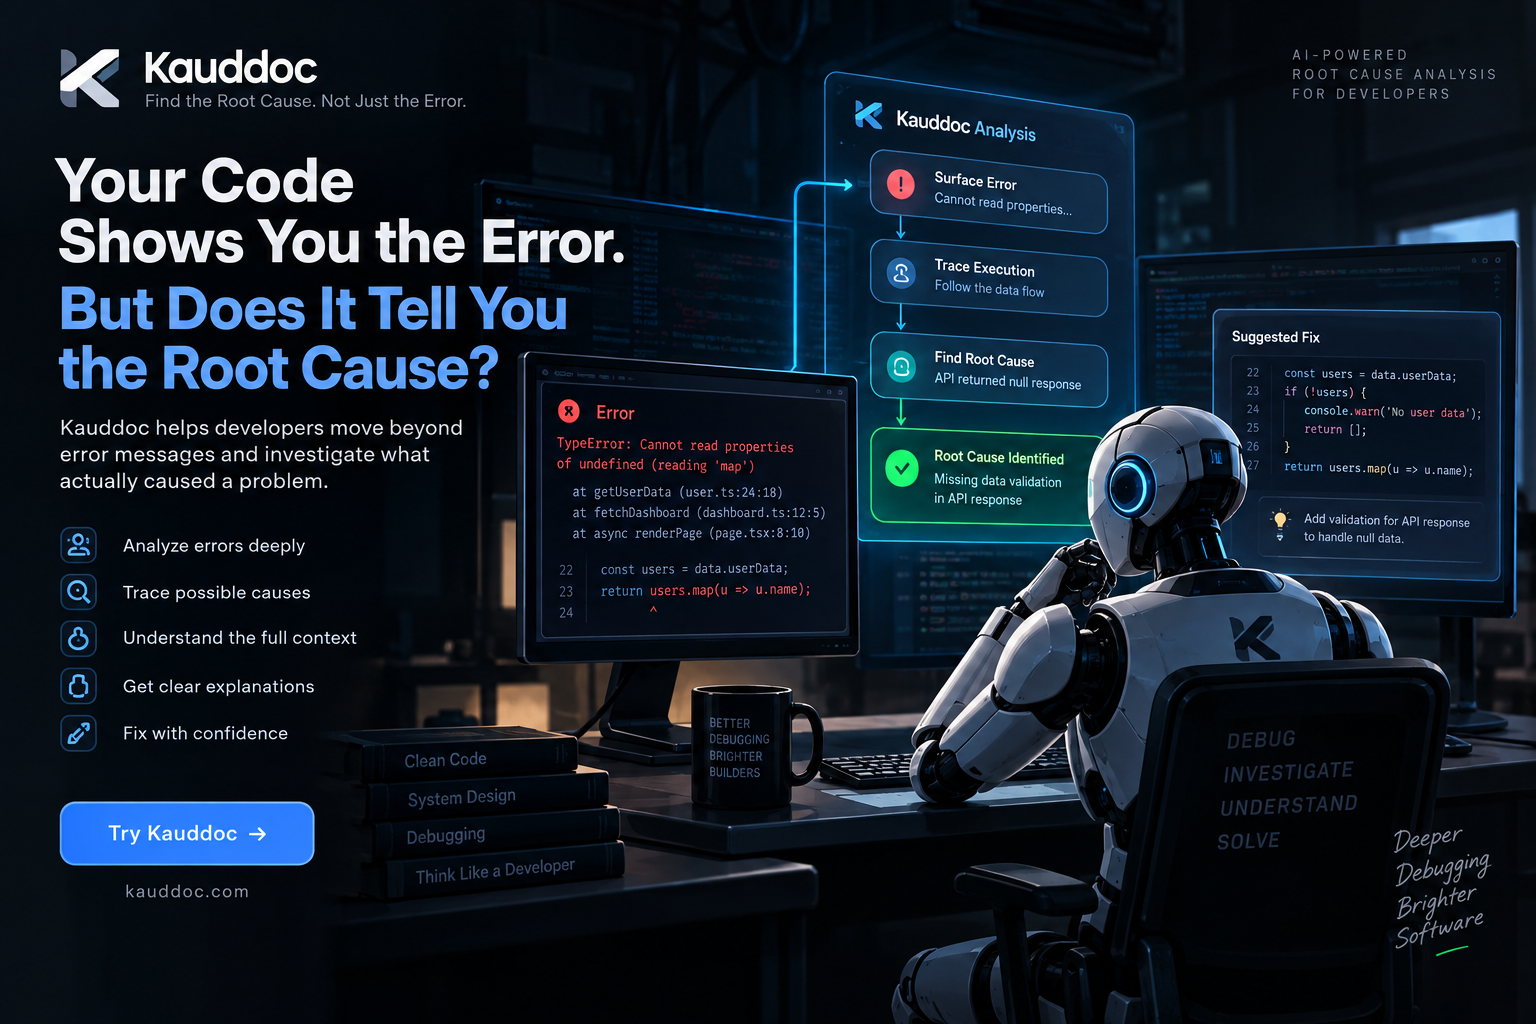
Kauddoc is focused on helping developers move beyond surface-level error messages.
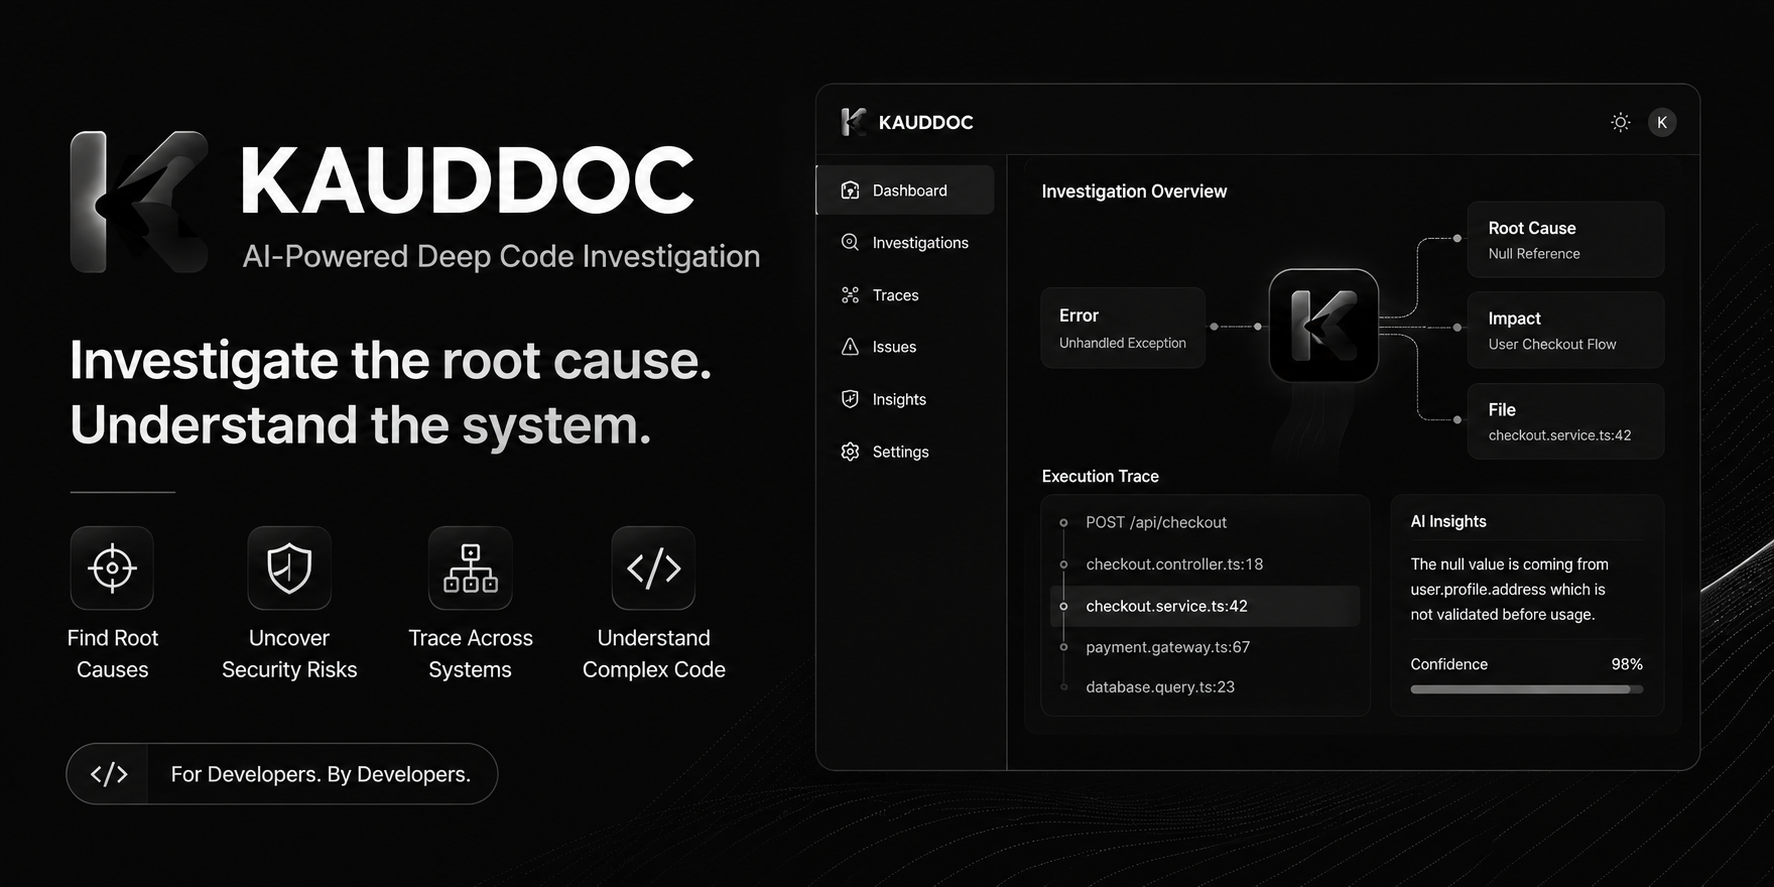
Our goal is to provide deeper error analysis that helps developers understand:
What the error means
What could be causing it
Where to investigate
What the potential root cause is
How to approach fixing it
We've recently upgraded our analysis engine to improve the accuracy and depth of the insights it provides.
We're still building, testing, and improving.
But the vision is simple:
Find the root cause. Not just the error.
We'd love developer feedback
We're building Kauddoc for developers, so honest feedback from the developer community is incredibly valuable.
If you spend time debugging applications, I'd love to know:
What is the most frustrating part of debugging for you?
And more importantly:
What would make an error analysis tool genuinely useful in your workflow?
We're listening and building.